The Scientific Information Reliability Chart™
A rigorously and regularly updated map of the scientific literature landscape so you can see at a glance the sources that are reliable and that place findings into a useful context.
The SIRC™ at a Glance
Each journal on the chart is placed based on dozens of papers rated using consistent criteria users can examine.
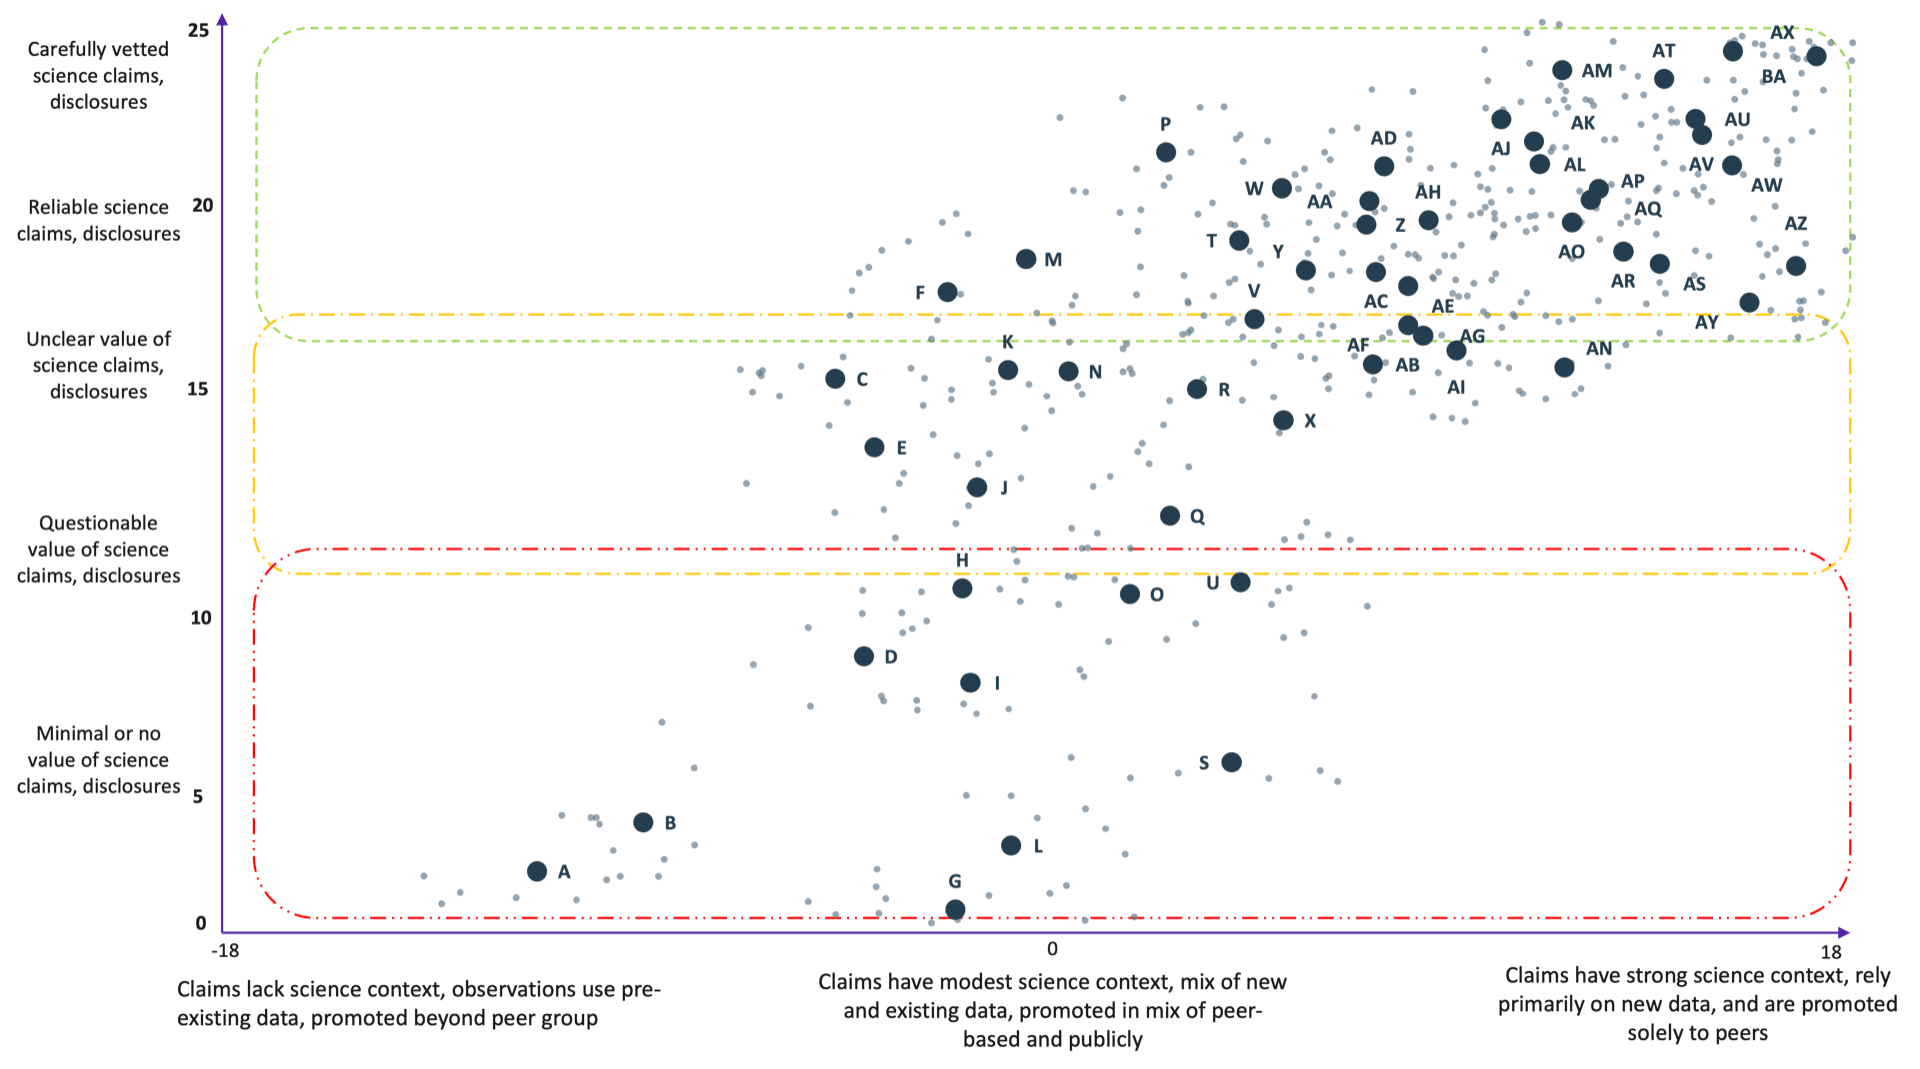
SIRC™ prototype — May 2026. Interactive version in development.
Two Axes. One Clear Picture.
The SIRC was inspired by the approach of the Media Bias Chart® a widely adopted tool in news literacy. Its visual, comparative, and accessible format allows for discussion, comparison, and interaction.
Vertical Axis
Reliability
Assesses the strength and reliability of a publication's claims. Scored 0–25 based on seven dimensions: submission to acceptance, financial disclosure, ethics disclosure, study design, study quality, claims, and clarity.
Higher scores indicate stronger editorial and peer-review standards that consistently produce trustworthy scientific claims.
Horizontal Axis
Relevance
Assesses how well a publication delivers and interprets interesting findings, and whether the publication is focused on its community. Scored −18 to +18 based on five dimensions: author expertise, peer-attenuated claims, original contribution, promotional focus, and community accountability.
Higher scores reflect publications that actively place science in meaningful context. Highly reliable publications can vary in relevance, which is why it is important to quantify both.
The Five Reliability Levels
Publications are assigned to one of five reliability tiers based on their SCORR methodology score.
Carefully vetted science claims and disclosures. Exemplary editorial standards with minimal bias.
Good vetting of science claims and disclosures. Strong editorial oversight with minor gaps.
Uncertain vetting of science claims and disclosures. Mixed standards; read with care.
Questionable vetting of science claims and disclosures. Significant reliability concerns.
Minimal vetting of science claims and disclosures. Predatory or severely compromised sources.
The Three Relevance Levels
The horizontal axis reflects how actively a publication helps readers interpret findings, from no context at all to precise guidance for practitioners.
Score -18 to -6
Low relevance
No meaningful aids to interpret or place findings in perspective. Readers must rely entirely on their own background to evaluate relevance. Findings amplified beyond scientific community.
Score -6 to +6
Mixed relevance
Some efforts to place findings in perspective. Varies in quality; may contextualize some findings well while leaving others unexplained. Findings amplified beyond scientific community.
Score +6 to +18
High relevance
Highly focused efforts to make findings relevant and provide practical interpretation. Rich editorial context, clear placement within the broader scientific conversation. Little to no amplification beyond core scientific community.
Dig Deeper
Methodology
How Scores Are Calculated (SCORR)
Learn about the Systematic Calculation of Reliability and Relevance (SCORR): its twelve scoring dimensions, our analysis process, and how individual article scores aggregate to publication-level ratings.
Read the methodologyTaxonomy
How Publications Are Classified (SIRRS)
Explore the Scientific Information Reliability & Relevance System (SIRRS), the classification framework that maps papers to zones on the SIRC™.
Explore the taxonomyInterested in Using the SIRC™?
Whether you're a publisher, funder, library, or researcher, we'd love to discuss how the SIRC™ can work for you.
Contact Us